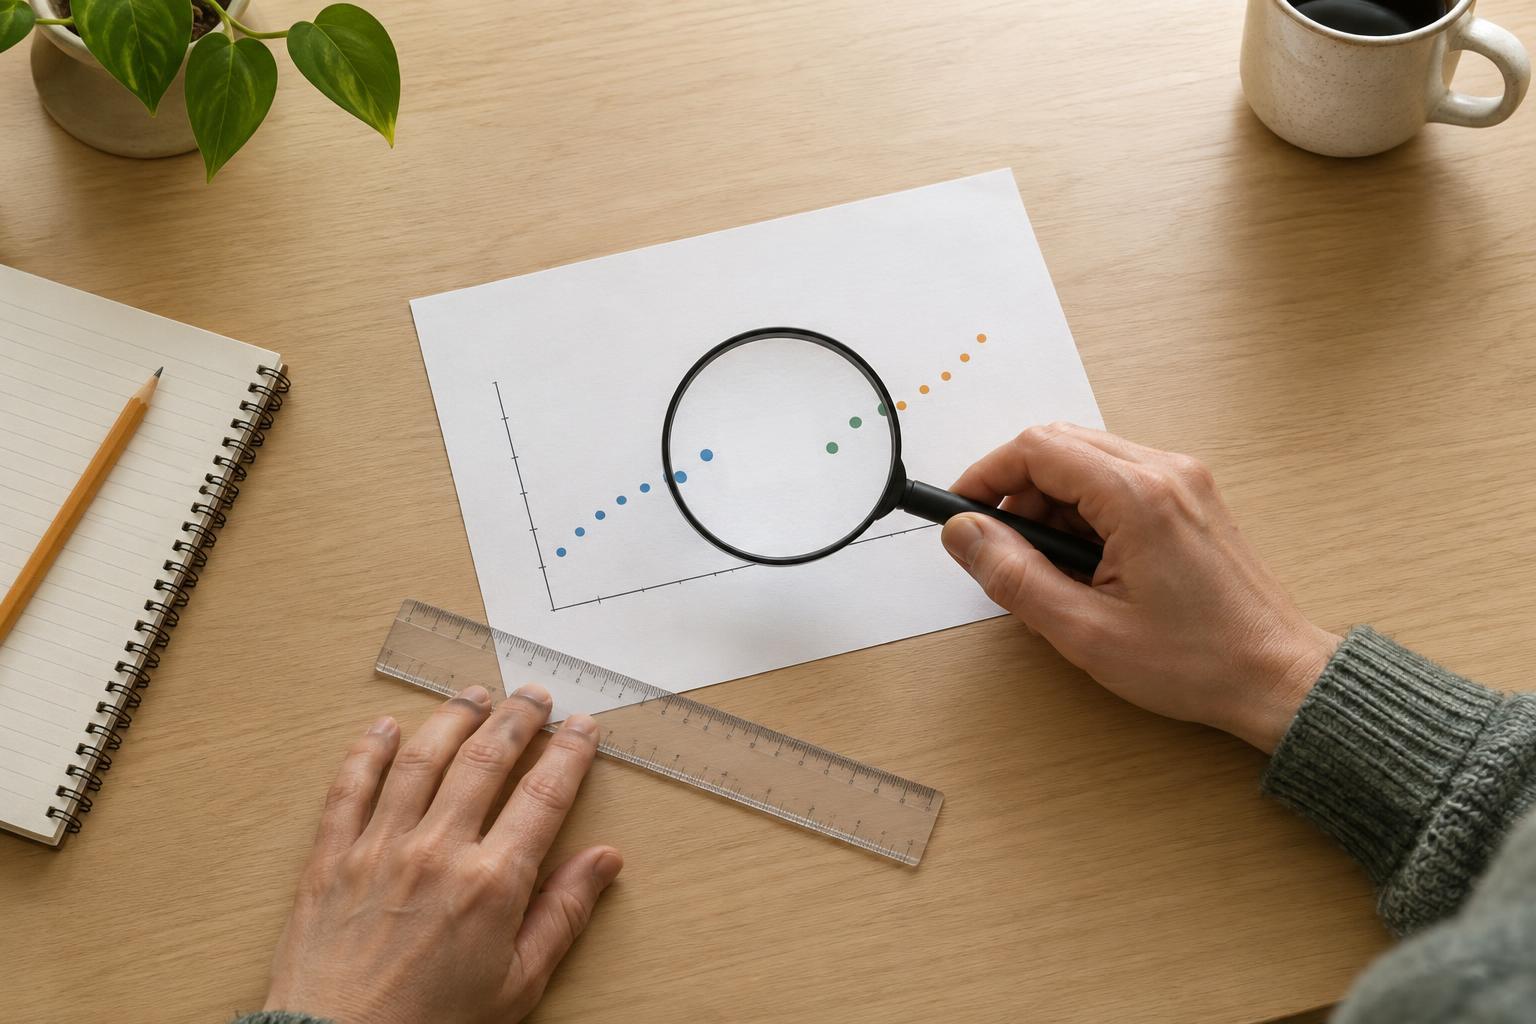
Start with the claim, then read the labels
Charts are easy to absorb while scrolling. A line rises, a bar towers over its neighbor, or two shapes appear to move together. Before deciding what the picture means, put its apparent claim into words: What is changing, compared with what, and over which period? Then check whether the title, axes, units, and legend actually support that claim. A chart titled “Engagement is growing,” for example, might show total comments rather than the share of viewers who commented. Those measures answer different questions.
Look for what each mark represents. Is a point one day, one month, or an average across several months? Do the bars show counts, percentages, or rankings? “More posts” does not necessarily mean “more active creators,” because one creator can publish many posts. If a label is absent or vague, resist filling the gap with the most dramatic interpretation. The chart may still be useful, but its meaning is narrower than its visual impact suggests.
Check where the axes begin and how they move
A vertical axis that starts above zero can make a modest difference look enormous. Imagine two bars representing 48 and 52 responses. If the axis begins at 45, the second bar may appear much taller, even though the difference is four responses. For bar charts, where height itself communicates quantity, a zero baseline is usually the clearest choice. If the baseline is cropped, compare the printed values rather than judging only by height.
Not every axis needs to begin at zero. A line chart showing small changes in a temperature reading may use a narrower range to make those changes visible. The question is whether the range helps you inspect the data without hiding its broader context. Also check the spacing: equal distances on an axis should represent equal steps unless the chart clearly says otherwise. An axis with uneven time intervals can make a gradual change look sudden.
Notice when a different scale changes the story
Some charts use a logarithmic scale, where equal distances represent equal proportional changes rather than equal additions. That can be helpful when values span a very wide range, but it changes how you should read the slope. A line that looks steady on such a chart does not describe a steady number of new units each time. If you see a scale you do not recognize, read its tick labels before interpreting the shape.
Be especially cautious with charts that place two measures on separate vertical axes. A chart might show posts published on the left and audience searches on the right. Adjusting either axis can make the lines appear closely matched or far apart without changing the underlying values. Similar-looking movement may suggest a question worth exploring, but it does not, by itself, establish that one measure caused the other.
Ask what the chart leaves out
A chart can be accurate about the data it displays and still give an incomplete picture. Check the time window: Does the series begin just before a jump or end just before a decline? Look for missing categories, unreported responses, and groups that have been combined. A chart of reactions from people who answered a poll tells you about those respondents; without more context, it does not tell you what everyone in a community thinks.
Denominators matter, too. A rise in the number of comments might accompany a much larger rise in views. In that case, comments per view could tell a different story from total comments. Likewise, an average can conceal a wide spread of experiences. When possible, seek the underlying counts, definitions, or a second view of the data. If they are unavailable, describe the limitation instead of assuming the omitted information would confirm the headline.
Use a quick pause before you share
You do not need to rebuild a chart to read it more carefully. Pause long enough to ask five questions: What is measured? What do the axes and units mean? Where do the scales begin? Which people, categories, or periods are missing? Does the caption say more than the visual shows? These checks are especially useful when an image has been reposted without its original caption, because the surrounding explanation may have been lost.
Critical reading does not mean assuming every striking chart is misleading. A cropped axis might make a small but meaningful change easier to see, and a limited sample might answer a carefully limited question. The goal is to match your conclusion to the evidence. Instead of saying “this proves audiences are leaving,” you might say “this chart shows fewer responses in the period displayed.” That small shift makes room for context—and makes the chart more useful.